Canva and Your Real Estate Statistics

Need a new way to share statistics? Canva is a simple way to build designs for just about anything. If your goal is to differentiate the way you share information consider Canva. Photos and video are a great way to jump into social media to reach theis sight and sound generation.
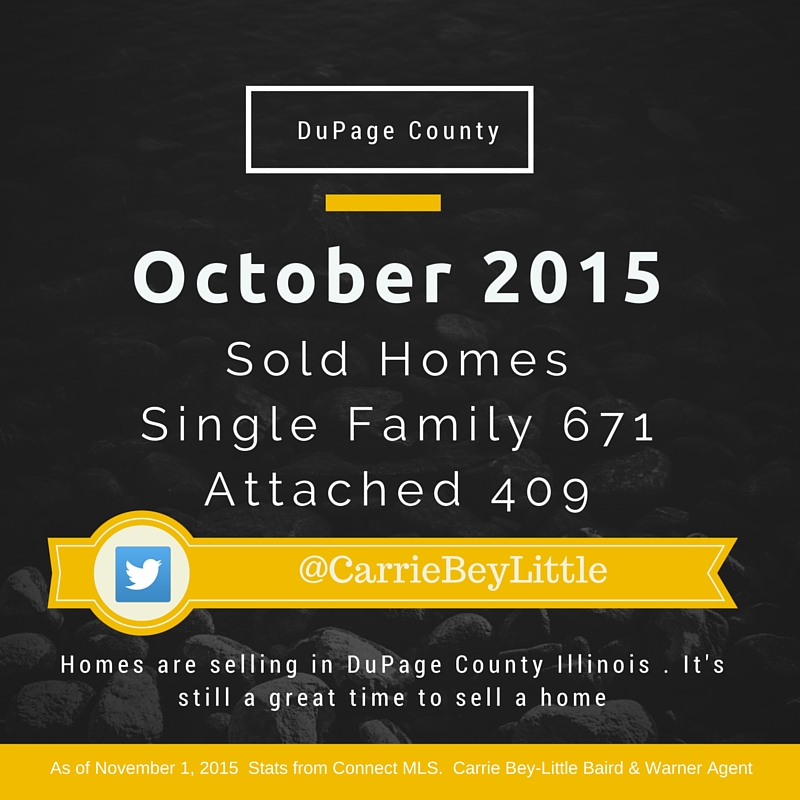
As a licensed real estate professional with Baird & Warner I understand the importance of sharing statistics with my buyer and seller clients. I also understand that it’s not a good idea to just share the data. We must understand what we are sharing and the best way to share data is to “keep it simple”. I’ve kept it simple for you:
Yes, I am the Tech Savvy agent. However, this is so simple anyone can build an infographic that can be share on social media, your blog and email. Take advantage of Canva. Many of the designs are at no charge and other designs charge $1.00. If you are going to try this graphic tool consider the following:
- Prepare your stats research first. I use a tool from 10K Research to get statistics for my areas. If you aren’t using a 3rd party go back to your multiple listing service.
- Consider a larger market place and your local neighborhoods. Counties, the entire city and your subdivision.
- Remember to add your brokerage to your graphic, name or company logo.
- Add your email address, link to your website and maybe your phone number. If someone is reading your statistics online the contact method might be email, social media, a website or text.
- Make this a part of your monthly online marketing. Schedule time to build these graphics each month.
- If you’re not tech savvy and need help ask your kids, a local college student or the new agent that could use the extra cash.
- Now share it on Pinterest, Facebook, Instagram and Twitter.
- Take it one step further and use this infographic in a direct mail campaign.
Go for it and dominate your market place online.

